After winning the National Title, Dabo Swinney declared the ACC the best conference in College Football. That was coming off of a tremendous bowl season for the Conference, as well as a National Title. But this is also after a regular season in which the Big Ten dominated headlines, and the annual discussion of conferences centers of the SEC. Do the numbers back up Swinney's claim?
I've updated the rankings from my previous post, and the numbers back up his statement.

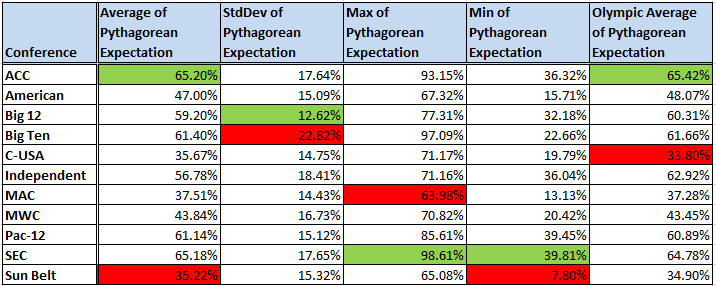
The ACC, by an incredibly narrow margin (.02 percentage points more than the SEC), had the highest average Pythagorean expectation. That is despite their top team, Clemson (93.15%), being third in Pythagorean expectation behind Alabama (98.61%) and Michigan (97.09%). They also lead the pack if you use an Olympic Average to remove the impact of outliers. The Olympic Average, designed to prevent corrupt judges from rigging Olympic Figure Skating, takes the average of all but the maximum and minimum of a set. And in that, the ACC continues to be the top dog, with an inflated by Alabama SEC behind by .64 percentage points. The Big Ten was a third using both measures (in the table, the Olympic Average of the three Independent teams appears to be higher; but since that's a single team, BYU, it should be ignored for analysis), followed by the Pac-12 and Big 12 among the Power 5. The SEC also managed to have the best worst team, South Carolina (39.81%), which is something to hang your hat on.
An interesting story is told by the standard deviations of teams. The Big Ten won the dubious honor of being the most inconsistent conference, with a standard deviation of 22.82 percentage points. That's due to having both Michigan in the conference... and Rutgers (22.66%), as well the struggling Illinois (35.01%) and (sigh) Purdue (32.76%). The SEC and ACC are close in standard deviation (17.65 and 17.64 percentage points, respectively), with the Big 12 the most consistent. Some of that results from being the smallest Power 5 conference at 10 teams; some also results from having the worst best team (Oklahoma, 77.31%) in the Power 5 so there is no high outlier to bring up the standard deviation. Compared to some of the Group of 5 conferences that have some terrible teams (overall worst Texas State, 7.80%, I'm looking at you) as well as some decent teams, Kansas (32.18%), the second worst Power 5 team, is still better than 24 teams, among them all of the worst team in each Group of 5 conference, and Rutgers (but not Purdue; Boiler Up!).
So ACC, congratulations. You have reached the high peak of college football. You have dethroned theconference of arrogant jerks SEC. The Clemson Tigers have had one amazing season, and as an underdog beat Alabama to earn a National Title. And top to bottom the conference is filled with good teams.
Now, if only September could come again... 8 months is too long of a wait for another season.
I've updated the rankings from my previous post, and the numbers back up his statement.
The ACC, by an incredibly narrow margin (.02 percentage points more than the SEC), had the highest average Pythagorean expectation. That is despite their top team, Clemson (93.15%), being third in Pythagorean expectation behind Alabama (98.61%) and Michigan (97.09%). They also lead the pack if you use an Olympic Average to remove the impact of outliers. The Olympic Average, designed to prevent corrupt judges from rigging Olympic Figure Skating, takes the average of all but the maximum and minimum of a set. And in that, the ACC continues to be the top dog, with an inflated by Alabama SEC behind by .64 percentage points. The Big Ten was a third using both measures (in the table, the Olympic Average of the three Independent teams appears to be higher; but since that's a single team, BYU, it should be ignored for analysis), followed by the Pac-12 and Big 12 among the Power 5. The SEC also managed to have the best worst team, South Carolina (39.81%), which is something to hang your hat on.
An interesting story is told by the standard deviations of teams. The Big Ten won the dubious honor of being the most inconsistent conference, with a standard deviation of 22.82 percentage points. That's due to having both Michigan in the conference... and Rutgers (22.66%), as well the struggling Illinois (35.01%) and (sigh) Purdue (32.76%). The SEC and ACC are close in standard deviation (17.65 and 17.64 percentage points, respectively), with the Big 12 the most consistent. Some of that results from being the smallest Power 5 conference at 10 teams; some also results from having the worst best team (Oklahoma, 77.31%) in the Power 5 so there is no high outlier to bring up the standard deviation. Compared to some of the Group of 5 conferences that have some terrible teams (overall worst Texas State, 7.80%, I'm looking at you) as well as some decent teams, Kansas (32.18%), the second worst Power 5 team, is still better than 24 teams, among them all of the worst team in each Group of 5 conference, and Rutgers (but not Purdue; Boiler Up!).
So ACC, congratulations. You have reached the high peak of college football. You have dethroned the
Now, if only September could come again... 8 months is too long of a wait for another season.
Comments
Post a Comment