
NASL Power Rankings, Games Through 4/7/2017


Definitions:
  • Pythagorean Expectation, Preseason = The previous year's Real Pythagorean Expectation, with a factor of regression to the mean based on the year-to-year correlation of  Real Pythagorean Expectation.
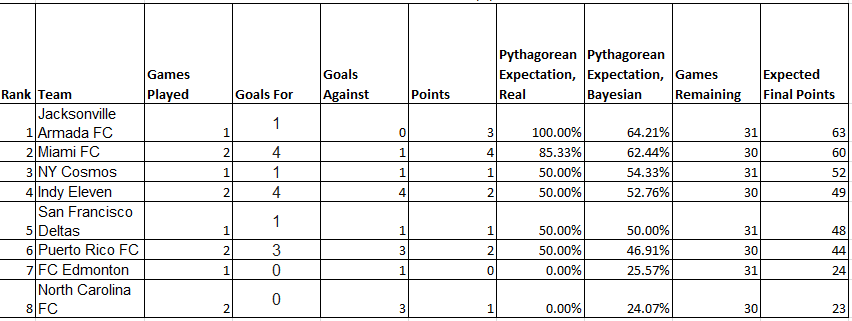
  • Pythagorean Expectation, Real = Pythagorean expectation of points, based upon goals scored and goals allowed so far this season. An exponent of 1.27, derived from analysis of previous NASL seasons, is used
  • Pythagorean Expectation, Bayesian = The main power ranking. Using Bayes' Theorem, updates its value accounting for new information. Begins with the preseason ranking, then updates week to week after that. 
  • Expected Final Points = Using the Bayesian Pythagorean Expectation, the number of points a team has already, and the possible points remaining, is found
Why am I doing a power ranking for Division II soccer league? Because it is the league Indy has a team in.

Comments

Popular posts from this blog

This Year's Bowl Season Was As Bad For The Big Ten As It Looked.

After this year's bowl games, the narrative that developed among the sports media was the Big Ten, after what seemed like a historically strong regular season, proved to be weak after a terrible bowl performance. But how bad was that bowl performance? To find out, I compared the actual performance of the conferences to a set of 10,000 simulations of this year's bowl games, excluding this Monday's National Championship Game. To create the simulations, I used log5 and Pythagorean expectations, as I did previously for the NFL and MLB . However, because of the variability in strength of schedule in college football, using actual points scored for the Pythagorean expectations would be inaccurate. Instead, I'm using the Football Outsider's S&P+ ratings of offense and defense  (referenced on 1/4/2017), which adjust for strength of schedule and account for efficiency as well as performance.  To rate the performance of each conference, I found the percentile of t...

2018 Weekly Boiler Stat Summaries: Week 8, v. an Ohio State University

I could say something emotional about the win, OR I could hope we all have our own memories that may or may not include a realization of how low our TV room ceilings are. a Bad Defense and The Great Offense Going into Saturday's game , I was pretty confident the Boilers - a pretty darn solid offense - would have success scoring against a struggling Buckeye defense. That is exactly what happened. These are numbers that should be left to stand on their own because HOLY MACKEREL PURDUE DID THAT TO OHIO STATE. Figure 1: Purdue Individual Rushing Statistics [1,2] Figure 2: Purdue Individual Passing Statistics [1,2] Only thing to note is that Purdue's rushing came mainly from some explosive runs from Knox rather than a consistent set of runs from all the backs. This isn't exactly what you want to see for success through a season (and a sign run blocking may need a bit of work), but you have to give D.J. some credit here. an Inability to Score The Buckeyes, at le...

Making a Spreadsheet, Checking It Twice, Gonna Find Out When It's Socially Acceptable to Listen To Christmas Music

It’s that time of year again. And by that time, I mean the time when you aren’t sure if it’s too early to hear Christmas music yet. Is it OK to walk into a certain coffee shop chain in early November and grab a seasonal beverage that can barely call itself coffee? Is it too early to hum a carol when I’ll be waiting to get on a plane the day before Thanksgiving? While driving to your favorite Black Friday activity (the correct answer is skeet shooting or watching football), should the speakers be spreading holiday cheer? Or do you need to wait until you break out the advent calendars to put on a festive record? To answer this age old question, I’m trusting the fine Google searches of my fellow Americans. Using Google Trends data from 2012-2016, I’m going to compare each week of the years’ average searches for the term “Christmas music” as a percentage of the maximum to determine when Americans start listening to Christmas music [1]. Figure 1: Christmas Graph, Oh Christmas Graph ...