Yes, I know the bowl game was almost a month ago and I
promised a significant amount more content than I actually produced. However,
the current project in my day job has taken most of my time, bandwidth, and
energy, so that significantly delayed this post. But it’s here. Finally. The
stat summary for Purdue’s first bowl victory since before I became a brother of
Kappa Kappa Psi.
Purdue Quarterback: ACLs
Not Required
Elijah Sindelar is only the latest player to have suffered
an ACL tear as a result of whatever is in the West Lafayette water causing the
injury endemic for Boilermakers of all sports. Sindelar’s performance while
playing injured since the Northwestern game as been pretty decent, including the
Foster Farms Bowl [1].
 |
| Figure 1: Purdue Individual Passing Statistics [2,3] |
Sindelar, with only a single functioning knee, threw 53
passes for 396 yards, with a completion percentage of 62.26% and 6.61 yards per
dropback. Given the Boilers were facing an Arizona defense that allowed 6.77
yards per dropback, this improvement over Purdue’s season average of 5.83 yards
per dropback was expected. Sindelar took advantage, throwing four touchdowns
including one in the last two minutes as part of a quick drive that gave the
Boilers the final lead. Sindelar, with the game put in his hands use of the
62.22% of plays called as passes (compared to a season average of 55.83%),
delivered [2,3,4].
Yet Another Boiler
Who Tore His ACL
Complementing the passing attack was a rushing attack that
faced an Arizona defense that had been shredded for 5.81 yards per rush (FBS
average: 4.97). The Wildcats actually held a relatively strong (5.28 yards per
rush, compared to the FBS average of 5.08) Boilermaker rushing attack to 5.56
yards per rush. In particular, Markell Jones was rather pedestrian, with only
4.10 yards per rush on 21 rushes. While I expected significantly more from the
rushing attack it wasn’t bad, and the passing attack made it up for the offense
which had a spectacular 6.72 yards per play – compared to the Boiler’s season
average of 5.59 yards per play (FBS average 5.76) [2,4].
 |
| Figure 2: Purdue Individual Rushing Statistics [2,3] |
D.J. Knox, with half the rushes of Jones, was much more
productive – netting an incredible 9.18 yards per rush. The ACL he tore in the 2016
Spring Game apparently healed up nicely, with the 101 rushing yards
supplemented by 3 catches for 36 yards.
Phillips Caught Wide
Open Passes!
Gregory Phillips, despite being tied as the Boiler’s top
targeted receiver (67 targets, tied with Jackson “I’m-Not-Convinced-He-And-His-Brothers-Aren’t-One-Regenerating-Time-Lord”
Anthrop), was only second in catches due to a tendency to drop his targets.
Compared to an FBS average of a catch rate of 57.7%, Phillip’s rate of 65.7% is
slightly above average but many of the drops are frustratingly occurring when
Phillips is wide open. Against the Wildcats Phillips was playing like an
absolute stud at receiver, catching 80% of his 17 targets for 149 yards – good
for 8.76 yards per target and two touchdowns [2,3,5,6].
 |
| Figure 3: Purdue Individual Receiving Statistics [2,3] |
While the Meaty French Mitts of Anthony Mahoungou caught slightly
below his season average of 64.5%, his 19.7 yards per target was significantly
above his season average of 11.33 and cements him as Purdue’s most productive
receiver [2,3,6].
Another Game, Another
Great Job By Purdue’s Rushing Defense
During the season Arizona’s rushing offense was an
unstoppable force, averaging 6.98 yards per rush and blowing away not just the
FBS average of 5.08 yards per rush but also the 6.52 average yards per dropback.
Against the Boilers, they were held to a squalid 3.72 yards per rush [2,3,4].
 |
| Figure 4: Arizona Individual Rushing Statistics [2,3] |
Khalil Tate, who at quarterback had 11.43 yards per rush
coming in and led the FBS in yards per rush, was made to be below average with
4.69 yards per rush compared to an FBS average of 5.08. Other than Shun Brown,
who had 2 carries, no Wildcat rusher had above the FBS average. The Boilers
dominated yet another rushing attack. The fact that Nick Holt, who took a
defense that was allowing 5.82 yards per rush and 6.85 yards per dropback and
created a unit who allowed 4.20 yards per rush and 6.33 yards per dropback, did
not win the Broyles Award is an absolute travesty [2,3,4].
In the passing attack, however, Tate carried the Wildcats to
their near victory. On 26 attempts, he had 5 touchdowns and 9.50 yards per
dropback (FBS average: 6.52). Luckily for the Boilers, he had a late
interception that sealed Purdue’s first bowl victory since 2011. This was with
significant pressure – the Boilers were getting a sack on 13.33% of dropbacks. Kevin
Sumlin is walking into a building with a dynamic rusher and passer at
quarterback, and I would be scared to be in the Pac-12 South in 2018 [2,3].
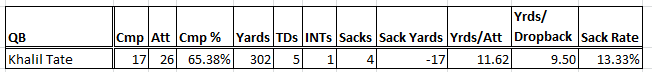 |
| Figure 5: Arizona Individual Passing Statistics [2,3] |
Tale of Two Seasons
There are a lot of ways to show the massive improvement
between 2016 and 2017 for Purdue football. Over double the number of wins. A
bowl game. Not being a joke. Nothing speaks like data speaks, and in that the
2017 Boilers show an incredible amount of improvement that one can only hope
will hold for years to come.
 |
| Figure 6: 2016 Purdue Team Statistics [4,8] |
 |
| Figure 7: 2017 Purdue Team Statistics [4,6] |
And yes I promise, more content is coming. If anyone has requests (Purdue Men's Basketball? Women's Basketball? Other Purdue Sports? Olympics? Soccer? Fiction v. Engineering? Politics?) feel free to comment.
Boiler Up!
References
[1] http://www.espn.com/college-football/story/_/id/21900760/purdue-boilermakers-elijah-sindelar-played-games-torn-acl
[2] http://www.espn.com/college-football/boxscore?gameId=400959398
[3] http://www.espn.com/college-football/playbyplay?gameId=400959398
[4] http://stats.ncaa.org/
[5] http://ncaasavant.com/targets.php
[6] https://www.footballstudyhall.com/pages/2017-purdue-advanced-statistical-profile
[7] http://speakwithdata.blogspot.com/2017/12/2017-bowl-game-preview-foster-farms.html
[8] https://www.footballstudyhall.com/pages/2016-purdue-advanced-statistical-profile
[8] https://www.footballstudyhall.com/pages/2016-purdue-advanced-statistical-profile
Comments
Post a Comment