
Grid O' Sadness: Update and Methodology

Earlier this week (prior to the start of the World Series) I posted the Grid O' Sadness, showing the relative odds of the Cubs, Bears, Indians, and Browns winning the most of their remaining games. Since then, the Indians have won two games, the Cubs one, and my promise to explain my methodology struggled to happen. Since Purdue is currently struggling against Penn State, I decided to get my mind off those struggles by explaining the methodology.

First though, an update to the Grid O' Sadness (again, I apologize):

So, that's looking up for the Indians.

The model I created to simulate the remainder of the season is based on two statistical tools: the Pythagorean expectation (1), which I used in my discussion of the NFL preseason, and log5 (2). Both were developed by Bill James to analyze teams in baseball. The Pythagorean expectation uses the points (I'm saying points instead of runs to use the same term across multiple sports) scored and points allowed by a team to create an expectation of the winning percentage of a team. This tends to be more accurate at rating teams than the real winning percentage. For the MLB teams, I used their regular season statistics (3); since on average the average MLB team is average, it gives a more equivalent comparison than including postseason statistics that are dependent on the teams faced in the postseason (which vary in ability significantly) For the NFL teams, I used their statistics (4) so far on a per-game basis (since NFL teams have played differing numbers of game); since we are about halfway through the season, the average team they have faced can be assumed to be average.

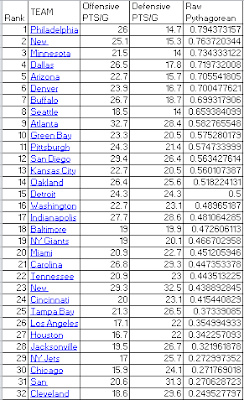
Ok, having rated the two World Series teams and the entire NFL (I am pretty meh to say my Washington Redskins are at 16th), I can use those the Pythagorean expectations to calculate game odds using Log5, which takes the winning percentage of two teams to create the probability a team will win. Using the probabilities, the World Series and remaining NFL schedules (5, 6) of the teams of Cleveland and Chicago can be simulated (100000 times), producing win totals (and the probabilities of them) and the resulting Grid O' Sadness. 

Also, since as a result I had to produce rankings for the entire NFL (as of Wednesday), those are added to this post as well. Chicago, you can take away your Bears aren't the worst team in the NFL. Both the 49er and Browns are worse teams than you. For Cleveland fans... well, at least you had the NBA title and maybe the World Series. And maybe your college football team of choice can not continuously turnover the ball. Boilers.

Citations
(1) https://en.wikipedia.org/wiki/Pythagorean_expectation
(2) https://en.wikipedia.org/wiki/Log5
(3) http://www.espn.com/mlb/standings/_/group/league
(4) http://www.espn.com/nfl/statistics/team/_/stat/total; http://www.espn.com/nfl/statistics/team/_/stat/total/position/defense
(5) http://www.clevelandbrowns.com/schedule-and-events/schedule.html
(6) http://www.chicagobears.com/gameday/schedule.html


Comments

Popular posts from this blog

2017 Weekly Boiler Stat Summaries: Week 13, v. IU

This is the first time the Bucket has been home since I was a junior at Purdue – the first year of Darrell Hazell’s tenure in West Lafayette. I am not nearly a good enough writer to capture my happiness in this moment. Purdue spent my entire post-college life (and half of college) being a joke nationally with very little to be proud of on Saturday afternoons in the fall. In just one year the narrative has changed. The Boilers won five games against FBS competition (a winning percentage of 11.36%) and three conference games (9.09%) during the 48-game Hazell era; in a single season, Brohm has won six FBS games, including four in conference, for a 50.00% winning percentage overall and 44.44% in conference. And with 6.8 second order wins (wins expected based on per play success rate) per S&P+, one may say that Purdue underachieved in the win column compared to how the Boilers played. Jeff Brohm has done something incredible this year, and capped it off with a win against IU – finally b...

Making a Spreadsheet, Checking It Twice, Gonna Find Out When It's Socially Acceptable to Listen To Christmas Music

It’s that time of year again. And by that time, I mean the time when you aren’t sure if it’s too early to hear Christmas music yet. Is it OK to walk into a certain coffee shop chain in early November and grab a seasonal beverage that can barely call itself coffee? Is it too early to hum a carol when I’ll be waiting to get on a plane the day before Thanksgiving? While driving to your favorite Black Friday activity (the correct answer is skeet shooting or watching football), should the speakers be spreading holiday cheer? Or do you need to wait until you break out the advent calendars to put on a festive record? To answer this age old question, I’m trusting the fine Google searches of my fellow Americans. Using Google Trends data from 2012-2016, I’m going to compare each week of the years’ average searches for the term “Christmas music” as a percentage of the maximum to determine when Americans start listening to Christmas music [1]. Figure 1: Christmas Graph, Oh Christmas Graph ...

This Year's Bowl Season Was As Bad For The Big Ten As It Looked.

After this year's bowl games, the narrative that developed among the sports media was the Big Ten, after what seemed like a historically strong regular season, proved to be weak after a terrible bowl performance. But how bad was that bowl performance? To find out, I compared the actual performance of the conferences to a set of 10,000 simulations of this year's bowl games, excluding this Monday's National Championship Game. To create the simulations, I used log5 and Pythagorean expectations, as I did previously for the NFL and MLB . However, because of the variability in strength of schedule in college football, using actual points scored for the Pythagorean expectations would be inaccurate. Instead, I'm using the Football Outsider's S&P+ ratings of offense and defense  (referenced on 1/4/2017), which adjust for strength of schedule and account for efficiency as well as performance.  To rate the performance of each conference, I found the percentile of t...