In the later half of this Premier League season, there has been discussion of a shifting of power between the two North London clubs, historically dominate Arsenal and the long-mediocre Tottenham Hotspur (1). This discussion peaked after a poor performance by Arsenal in their April 30th meeting at White Hart Lane, with Tottenham winning 2-0. Tottenham as been riding high this season; currently in second place in the table, they have punched their ticket to the Champions League, and if first place Chelsea stumbles down the stretch, could win the Premier League. Arsenal, after a hot start, have struggled this season; dominated by their rival clubs at the top of the Premier League, embarrassed by Bayern Munich in the Champions League, and on the outside of the top four. Having sunken to as low as sixth, the Gunners are now 4 points behind Liverpool's fourth place and Champions League. Their only glimmer of success has been reaching the FA Cup Final; while an accomplishment, they had been lucky with draws, seeing non-league teams Sutton United and Lincoln City in the Fifth Round and Quarterfinals, respectively. This has led to calls for Arsenal Manager Arsene Wenger to retire, and/or the ownership (including international football villain Stan Kroenke) (2) of the club to restructure the organization to improve on-pitch results.
Obviously, this season has seen a reverse of their historic trends on the field. And Tottenham has gone from consistent mid-table performances to competing for the title within the last few years. But is power truly shifting in North London? To answer that, I'm going to compare the clubs on five metrics: Premier League performance (measured by points), team strength (measured by Elo ratings), revenues, spending on wages, and interest from fans (measured by Google web searches).
The most obvious historic differences between the two clubs has been on the pitch. Wenger, arriving in 1996, had the Gunners consistently in the top four and competing for titles in the Premier League. He has won three Premier League titles and six FA Cups, adding to ten prior First Division/Premier League Titles and six prior FA Cups (3). Tottenham has won the First Division/Premier League of twice: 1950-1951, and 1960-1961, along with eight FA Cups, the last in 1990-1991 (4). Over Wenger's tenure, Arsenal has averaged a finish of 17.19 points ahead of Tottenham, and prior to this season, Tottenham has ended the season below Arsenal in each season. Granted, the gap has tightened over the past few years; the average gap since the 2009-2010 season has been 5 points, and this season the Spurs will finish ahead of the Gunners, with the gap projected to be 11 points in favor of the Spurs, as calculated by FiveThirtyEight (5)(6). Despite this year's struggles by Arsenal, over the long haul Arsenal remains the top club in North London. And while there has been some drop in Arsenal's performance since the early 2000's, much of the change has come from an improvement in Tottenham, who had a meager average of 47.8 points from 1996-2001, compared to 68.8 from 2011-2016.

Points in the Premier League do not create a complete picture of club performance, which can include European competition, and have limitations in measuring a club's strength. To get a better picture, I will also compare the Elo ratings of each club, as calculated by clubelo.com (7). Over Wenger's tenure, Arsenal has averaged a rating of 1852, while Tottenham has averaged a rating of 1729. In an average meeting, one would expect Arsenal to come away with 2.01 points in a match. As it stands today, Arsenal's rating is 1825 and Tottenham's is 1853; Arsenal would be underdogs in a match, expecting to come away with 1.38 points. Much like in points, Tottenham has narrowed the gap rather than Arsenal slipping significantly, as seen in Figure 2.

Unlike most American sport's franchises (excluding the publicly traded, non-profit Green Bay Packers), most European soccer clubs are Incorporated companies, and in Britain must file annual reports collected by the UK Government. This allows the direct viewing of financial documents as available from Companies House for both clubs, going back to 2001 for Arsenal and further back for Tottenham (8)(9).

Figures 3 and 4 show the revenues brought in by both club's corporate owners: Arsenal Holdings plc for Arsenal and Tottenham Hotspur Limited for Tottenham. For Arsenal, this includes the significant (as much as £156.9 million in 2010 and averaging £15.2 million annually since) revenues from property holdings; mainly the development of their former Arsenal Stadium in Highbury, London into apartments. I'm including this because having the ability to move stadiums and redevelop your old home into lucrative apartments is a significant projection of club power. That led to their highest revenues ever, an inflation adjusted £456.5 million in 2010. Tottenham has significantly lagged behind Arsenal in revenue; furthermore, since 2001 this gap has increased. Arsenal brought in £147.1 million more revenue than Tottenham in 2016; this would equal Tottenham's 2010 revenue. Indeed, Tottenham brought in less than Arsenal's 2010 revenue in 2016. Unlike on the pitch, Arsenal's power in North London, and their superior position over their rivals, has grown over time.


Figures 5 and 6 show the spending on wages by both clubs. It should be noted that because the filings to Companies House do not separate spending based on employee type; therefore, the wages will include players (not just the senior club, but also reserves, junior, and women's clubs) as well as other staff, including trainers, administration, and grounds staff. In 2016, for example, Arsenal employed 651 people: 68 players, 122 trainers, 355 administrative staff, and 106 grounds staff. Tottenham employed 409 people in the same year: 196 players & trainers, 134 administrative staff, and 79 retail & distribution staff. Because having the ability to employ more staff is a sign of greater club power, I will use the full wage numbers, as adjusted for inflation. Wages follow a similar trend to revenue; not only is Arsenal spending significantly more than Tottenham, but the amount more they have spent has increased. Tottenham is spending less than Arsenal spend in 2006, and have plateaued since 2011. Arsenal has continued increasing its spending. With only around 60% more employees, Arsenal is spent nearly double Tottenham in 2016.
One may figure that the ultimate measure a club's power is the attention paid by supporters and general fans of the sport. To measure that, I am going to use web searches from Google (10). The more supporters, and more engaged supporters a club has, it can be reasoned their searches will rise. Thus the ratio of searches between two clubs should reflect the relative attention paid to each. The searches used will be global searches; since Premier League is now a global phenomenon (as this Indianapolis resident, American born-and-bred Arsenal fan can attest to).

Sources and Footnotes
(1) https://www.theguardian.com/football/2017/apr/28/arsene-wenger-arsenal-spurs-tottenham
(2) Kroenke, in addition to his controlling interest of Arsenal, also owns the NFL's Rams, and was the driving force in moving the team from St. Louis to Los Angeles. His focus on financial, rather than on-pitch, performance in his ownership of Arsenal has drawn the ire of supporters.
(3) https://en.wikipedia.org/wiki/Arsenal_F.C.
(4) https://en.wikipedia.org/wiki/Tottenham_Hotspur_F.C.#Honours
(5) https://www.premierleague.com/tables
(6) https://projects.fivethirtyeight.com/soccer-predictions/?ex_cid=rrpromo
(7) http://clubelo.com/ENG
(8) https://beta.companieshouse.gov.uk/company/04250459/filing-history
(9) https://beta.companieshouse.gov.uk/company/01706358/filing-history
(10) https://trends.google.com/trends/explore?date=all&q=%2Fm%2F0xbm,%2Fm%2F0hvjr
Obviously, this season has seen a reverse of their historic trends on the field. And Tottenham has gone from consistent mid-table performances to competing for the title within the last few years. But is power truly shifting in North London? To answer that, I'm going to compare the clubs on five metrics: Premier League performance (measured by points), team strength (measured by Elo ratings), revenues, spending on wages, and interest from fans (measured by Google web searches).
The most obvious historic differences between the two clubs has been on the pitch. Wenger, arriving in 1996, had the Gunners consistently in the top four and competing for titles in the Premier League. He has won three Premier League titles and six FA Cups, adding to ten prior First Division/Premier League Titles and six prior FA Cups (3). Tottenham has won the First Division/Premier League of twice: 1950-1951, and 1960-1961, along with eight FA Cups, the last in 1990-1991 (4). Over Wenger's tenure, Arsenal has averaged a finish of 17.19 points ahead of Tottenham, and prior to this season, Tottenham has ended the season below Arsenal in each season. Granted, the gap has tightened over the past few years; the average gap since the 2009-2010 season has been 5 points, and this season the Spurs will finish ahead of the Gunners, with the gap projected to be 11 points in favor of the Spurs, as calculated by FiveThirtyEight (5)(6). Despite this year's struggles by Arsenal, over the long haul Arsenal remains the top club in North London. And while there has been some drop in Arsenal's performance since the early 2000's, much of the change has come from an improvement in Tottenham, who had a meager average of 47.8 points from 1996-2001, compared to 68.8 from 2011-2016.

Figure 1, Arsenal and Tottenham Hotspur's Final Points Total in the Premier League
Points in the Premier League do not create a complete picture of club performance, which can include European competition, and have limitations in measuring a club's strength. To get a better picture, I will also compare the Elo ratings of each club, as calculated by clubelo.com (7). Over Wenger's tenure, Arsenal has averaged a rating of 1852, while Tottenham has averaged a rating of 1729. In an average meeting, one would expect Arsenal to come away with 2.01 points in a match. As it stands today, Arsenal's rating is 1825 and Tottenham's is 1853; Arsenal would be underdogs in a match, expecting to come away with 1.38 points. Much like in points, Tottenham has narrowed the gap rather than Arsenal slipping significantly, as seen in Figure 2.

Figure 2, Arsenal and Tottenham Hotspur's Elo Ratings
Unlike most American sport's franchises (excluding the publicly traded, non-profit Green Bay Packers), most European soccer clubs are Incorporated companies, and in Britain must file annual reports collected by the UK Government. This allows the direct viewing of financial documents as available from Companies House for both clubs, going back to 2001 for Arsenal and further back for Tottenham (8)(9).

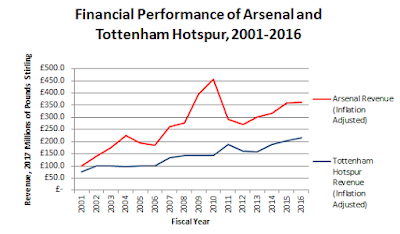
Figure 3, Revenues of Arsenal and Tottenham Hotspur Since 2001

Figure 4, Revenues of Arsenal and Tottenham Hotspur Since 2001
Figures 3 and 4 show the revenues brought in by both club's corporate owners: Arsenal Holdings plc for Arsenal and Tottenham Hotspur Limited for Tottenham. For Arsenal, this includes the significant (as much as £156.9 million in 2010 and averaging £15.2 million annually since) revenues from property holdings; mainly the development of their former Arsenal Stadium in Highbury, London into apartments. I'm including this because having the ability to move stadiums and redevelop your old home into lucrative apartments is a significant projection of club power. That led to their highest revenues ever, an inflation adjusted £456.5 million in 2010. Tottenham has significantly lagged behind Arsenal in revenue; furthermore, since 2001 this gap has increased. Arsenal brought in £147.1 million more revenue than Tottenham in 2016; this would equal Tottenham's 2010 revenue. Indeed, Tottenham brought in less than Arsenal's 2010 revenue in 2016. Unlike on the pitch, Arsenal's power in North London, and their superior position over their rivals, has grown over time.

Figure 5, Arsenal and Tottenham Wages Paid

Figure 6, Arsenal and Tottenham Wages Paid
Figures 5 and 6 show the spending on wages by both clubs. It should be noted that because the filings to Companies House do not separate spending based on employee type; therefore, the wages will include players (not just the senior club, but also reserves, junior, and women's clubs) as well as other staff, including trainers, administration, and grounds staff. In 2016, for example, Arsenal employed 651 people: 68 players, 122 trainers, 355 administrative staff, and 106 grounds staff. Tottenham employed 409 people in the same year: 196 players & trainers, 134 administrative staff, and 79 retail & distribution staff. Because having the ability to employ more staff is a sign of greater club power, I will use the full wage numbers, as adjusted for inflation. Wages follow a similar trend to revenue; not only is Arsenal spending significantly more than Tottenham, but the amount more they have spent has increased. Tottenham is spending less than Arsenal spend in 2006, and have plateaued since 2011. Arsenal has continued increasing its spending. With only around 60% more employees, Arsenal is spent nearly double Tottenham in 2016.
One may figure that the ultimate measure a club's power is the attention paid by supporters and general fans of the sport. To measure that, I am going to use web searches from Google (10). The more supporters, and more engaged supporters a club has, it can be reasoned their searches will rise. Thus the ratio of searches between two clubs should reflect the relative attention paid to each. The searches used will be global searches; since Premier League is now a global phenomenon (as this Indianapolis resident, American born-and-bred Arsenal fan can attest to).

Figure 7, Relative Number of Google Searches for Arsenal and Tottenham Hotspur
As seen in Figure 7, since the earliest publicly available data from Google (January 2004), Arsenal has had more searches than Tottenham, although it varies significantly over time based on the news at various times (specific games, transfers, organizational changes, position in the League table that season, etc.). On average, Arsenal has had 3.29 times the searches as Tottenham. To help account for the temporary peaks and valleys of support, I will mainly focus on a 1-year average for analysis. That average peaked for Arsenal at 8.78 times in June of 2014; it has declined since then as Tottenham's on field performance has improved, but the average has remains for Arsenal at 3.23 times, higher than even at the beginning of Google's data, 2.80 times in 2004. While the single best month for Tottenham has been Arsenal at 1.34 times in April of 2016, and this past year has seen a tightening, Arsenal still is in the lead in attention, although a slimmer lead. Depending on performance down the stretch this season and early next season, Arsenal may be able to regain their lead.
Reports of Arsenal's demise have been premature. They still are the significantly more powerful North London club at the bank, and still have more fan attention than Tottenham. Despite Tottenham having a better season this year than Arsenal, one year is not a long term trend. Arsenal still has been the historic leader, even if Tottenham is no longer the consistently floundering club and have been able to compete year-to-year. This may even strengthen the rivalry, making competition for the top of the league a new part of a historic derby, and fueling passions. Tottenham may have won the last battle, but in the long war of Premier League power, Arsenal are winning the war.
(1) https://www.theguardian.com/football/2017/apr/28/arsene-wenger-arsenal-spurs-tottenham
(2) Kroenke, in addition to his controlling interest of Arsenal, also owns the NFL's Rams, and was the driving force in moving the team from St. Louis to Los Angeles. His focus on financial, rather than on-pitch, performance in his ownership of Arsenal has drawn the ire of supporters.
(3) https://en.wikipedia.org/wiki/Arsenal_F.C.
(4) https://en.wikipedia.org/wiki/Tottenham_Hotspur_F.C.#Honours
(5) https://www.premierleague.com/tables
(6) https://projects.fivethirtyeight.com/soccer-predictions/?ex_cid=rrpromo
(7) http://clubelo.com/ENG
(8) https://beta.companieshouse.gov.uk/company/04250459/filing-history
(9) https://beta.companieshouse.gov.uk/company/01706358/filing-history
(10) https://trends.google.com/trends/explore?date=all&q=%2Fm%2F0xbm,%2Fm%2F0hvjr
Comments
Post a Comment