
So, my dad got married last Saturday. Purdue lost. I got married on October 1, 2016. Purdue lost. My sister got married on September 6, 2015. Purdue lost. Purdue football is 0-3 on my family's weddings. I'm sorry folks. It's all my fault.
OK, superstition didn't sink the Boilers. No - the Boilers, despite putting up good performances in some areas of the game, did so awful elsewhere that they lost a perfectly winnable game.
Of Penalties And Passing
The two biggest issues that held the Boilermakers back were struggles with penalties and throwing the ball. On the day, Purdue had 9 penalties for 55 yards - and 6 of those penalties were on the offense. Compared to a season average of 6.14 penalties a game for 54.57 yards, this wasn't a good day for Boilermaker discipline [1,2,3].
It also pushed the Boilermaker offense back repeatedly. In a typical game, the number of penalties Purdue had would be bad (they rank 64th in the nation in penalty yards per game) but not crippling. However, a rather successful passing offense would be needed to pick up big chunks of yards to move the chains when put into a corner by penalties. Purdue didn't have anything close to that against the Scarlet Knights.
Neither quarterback had success in the passing game; both failed to reach either the season average coming into the game of yards per dropback for Purdue's offense (5.87 yards per dropback) or allowed by the Rutgers defense (6.99 yards per dropback). This held Purdue back significantly, with the Boilers managing only 0.8 points and 31.6 yards per drive. With average starting field position at their own 21, the Boilermaker offense was consistently out of scoring position [1,2,3].
Born to Run
What is most frustrating is the rest of Purdue's performance was actually rather successful. Even missing Tario Fuller, the rushing attack was in high gear with 6.80 yards per carry on 41 carries. With the Scarlet Knights allowing 4.32 yards per rush coming into the game, this is an incredibly strong performance from the Boilermaker offensive line and running back corps [1,2].
The one complaint is that the play calling was under-utilizing the rush, with 51.76% of plays called as passes (57.5% of plays had been passes coming into the game). This led to the offense averaging 5.58 yards per play. While this matches the Purdue average coming into the day, the Scarlet Knight defense had allowed 5.62 yards per play coming into the game leaving Purdue slightly below that average. The 6.80 yards per rush would put Purdue at 6th in the nation if they had that as a season average, and given the success in this game it should have accounted for the bulk of plays. The running backs should have been trusted, rather than Blough on a rather obvious QB sneak (he ran from under center, which Purdue almost exclusively uses for QB sneaks and bootlegs) on a 4th and short situation. Going forward, the potent rushing attack should be utilized more when Purdue still has inconsistencies from receivers and quarterbacks [1,2].
We Were Halfway There
Much like the rushing attack, the defense did their part to win the game. Coming into the game, the Scarlet Knights had been averaging 4.64 yards per rush, 4.91 yards per dropback, and 4.75 yards per play. The Boilers held them to 3.92 yards per rush, 4.00 yards per dropback, and 3.94 yards per play. This was an exceptional performance from the Boilermakers. Yes there were a couple of big plays, but the Scarlet Knights were held to 14 total points and 0.93 points per drive. If the passing game had been competent, that should have been enough for the Boilers to cruise to a win. Instead, the Scarlet Knights rode off with a two point win. However, I think we are still the real winners here because we can pump our own gas, make a U-turn, and go to a grocery store and buy beer [1,2,3].
B-Word Update
Southwest flies direct to a wide variety of destinations out of IND, which means you won't be stuck in Atlanta at 1am because a flight crew needs to make its way across the airport.
When Life Gives You Corn Husks, Make Tamales
Ross-Ade will host its second night game this season on Saturday against the Nebraska Cornhuskers, who are sitting tied for second place in the Big Ten West at 2-2 in conference and 3-4 overall. A fanbase that was "suffering" through Bo Pelini's perpetual 9-4 seasons find themselves regretting getting rid of him as Mike Riley struggles at the helm. The Huskers of 2017 aren't the Huskers of old; they have struggled running the ball, with their 4.55 yards per rush ranking 90th in the country and somehow dwarfed by the FBS average of 5.12 yards per rush and Purdue's 5.48 yards per rush. With Purdue allowing only 4.57 yards per rush, this should be a favorable matchup for the Purdue defense [7,2].
This awful rushing offense is paired with an average passing offense, with the Huskers' 6.49 yards per dropback just shy of the FBS average of 6.53 yards per dropback. The Cornhuskers have done a good job in pass protection, with only 3.45% of dropbacks ending in a sack - compared to the FBS average of 6.02% and ranking 20th in FBS. This may be a possible trouble spot for a Boilermaker defense that has allowed 6.71 yards per dropback and has only gotten a sack on 3.47% of dropbacks [2].
The Nebraska defense has been a struggling unit, allowing 5.04 yards per rush (FBS average: 4.94), 6.57 yards per dropback (FBS average: 6.25), and 5.79 yards per play (FBS average: 5.57). With Purdue's strong rushing attack, there should be opportunities to move the ball and put up points. S&P+ is giving Purdue a 67% chance of winning, with a projected score of 30.2-22.7. That might be a bit bullish on the Boilers, but this is a team that has the ability to play at a high level - particularly at home. I'm going to be cautiously optimistic this week [2,5].
I've also added a new feature to the blog, a Ko-fi button on the header. Ko-fi is a service that allows readers to "tip" content creators a small amount (equivalent to an overpriced beverage from a coffee shop). If you like my work and want to show your appreciation with a small tip, press the button and it will take you to a page where you can give me a little of your hard earned money. If you don't feel like tipping, I will not be offended. Eyeballs reading my bad jokes is appreciation as well.
Boiler Up!
References
[1] https://www.sports-reference.com/cfb/boxscores/2017-10-21-rutgers.html
[2] http://www.ncaa.com/stats/football/fbs
[3] http://www.espn.com/college-football/playbyplay?gameId=400935387
[4] http://www.espn.com/college-football/boxscore?gameId=400935387
[5] https://www.footballstudyhall.com/pages/2017-purdue-advanced-statistical-profile
[6] https://www.footballstudyhall.com/pages/2017-nebraska-advanced-statistical-profile
[7] http://www.bigten.org/library/stats/fb-confsked.html
OK, superstition didn't sink the Boilers. No - the Boilers, despite putting up good performances in some areas of the game, did so awful elsewhere that they lost a perfectly winnable game.
Of Penalties And Passing
The two biggest issues that held the Boilermakers back were struggles with penalties and throwing the ball. On the day, Purdue had 9 penalties for 55 yards - and 6 of those penalties were on the offense. Compared to a season average of 6.14 penalties a game for 54.57 yards, this wasn't a good day for Boilermaker discipline [1,2,3].
It also pushed the Boilermaker offense back repeatedly. In a typical game, the number of penalties Purdue had would be bad (they rank 64th in the nation in penalty yards per game) but not crippling. However, a rather successful passing offense would be needed to pick up big chunks of yards to move the chains when put into a corner by penalties. Purdue didn't have anything close to that against the Scarlet Knights.
 |
| Figure 1: Purdue Passing Statistics [1,3,4] |
 |
| Figure 2: Purdue Quarterback Drive Statistics [3] |
Born to Run
What is most frustrating is the rest of Purdue's performance was actually rather successful. Even missing Tario Fuller, the rushing attack was in high gear with 6.80 yards per carry on 41 carries. With the Scarlet Knights allowing 4.32 yards per rush coming into the game, this is an incredibly strong performance from the Boilermaker offensive line and running back corps [1,2].
 |
| Figure 3: Purdue Rushing Statistics [1] |
We Were Halfway There
Much like the rushing attack, the defense did their part to win the game. Coming into the game, the Scarlet Knights had been averaging 4.64 yards per rush, 4.91 yards per dropback, and 4.75 yards per play. The Boilers held them to 3.92 yards per rush, 4.00 yards per dropback, and 3.94 yards per play. This was an exceptional performance from the Boilermakers. Yes there were a couple of big plays, but the Scarlet Knights were held to 14 total points and 0.93 points per drive. If the passing game had been competent, that should have been enough for the Boilers to cruise to a win. Instead, the Scarlet Knights rode off with a two point win. However, I think we are still the real winners here because we can pump our own gas, make a U-turn, and go to a grocery store and buy beer [1,2,3].
B-Word Update
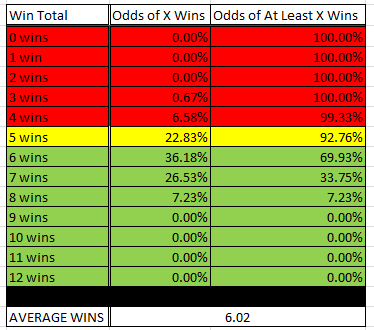 |
| Figure 4: Purdue Win Distribution [5] |
When Life Gives You Corn Husks, Make Tamales
 |
| Figure 5: Purdue Team Statistics [2,5] |
 |
| Figure 6: Nebraska Team Statistics [2,6] |
This awful rushing offense is paired with an average passing offense, with the Huskers' 6.49 yards per dropback just shy of the FBS average of 6.53 yards per dropback. The Cornhuskers have done a good job in pass protection, with only 3.45% of dropbacks ending in a sack - compared to the FBS average of 6.02% and ranking 20th in FBS. This may be a possible trouble spot for a Boilermaker defense that has allowed 6.71 yards per dropback and has only gotten a sack on 3.47% of dropbacks [2].
The Nebraska defense has been a struggling unit, allowing 5.04 yards per rush (FBS average: 4.94), 6.57 yards per dropback (FBS average: 6.25), and 5.79 yards per play (FBS average: 5.57). With Purdue's strong rushing attack, there should be opportunities to move the ball and put up points. S&P+ is giving Purdue a 67% chance of winning, with a projected score of 30.2-22.7. That might be a bit bullish on the Boilers, but this is a team that has the ability to play at a high level - particularly at home. I'm going to be cautiously optimistic this week [2,5].
I've also added a new feature to the blog, a Ko-fi button on the header. Ko-fi is a service that allows readers to "tip" content creators a small amount (equivalent to an overpriced beverage from a coffee shop). If you like my work and want to show your appreciation with a small tip, press the button and it will take you to a page where you can give me a little of your hard earned money. If you don't feel like tipping, I will not be offended. Eyeballs reading my bad jokes is appreciation as well.
Boiler Up!
References
[1] https://www.sports-reference.com/cfb/boxscores/2017-10-21-rutgers.html
[2] http://www.ncaa.com/stats/football/fbs
[3] http://www.espn.com/college-football/playbyplay?gameId=400935387
[4] http://www.espn.com/college-football/boxscore?gameId=400935387
[5] https://www.footballstudyhall.com/pages/2017-purdue-advanced-statistical-profile
[6] https://www.footballstudyhall.com/pages/2017-nebraska-advanced-statistical-profile
[7] http://www.bigten.org/library/stats/fb-confsked.html
Comments
Post a Comment